


To make an animated chart for free, paste your labels and values into a browser chart maker and pick a chart type. The chart draws itself in, and it morphs to its new shape whenever you change a number or switch types. Then copy the embed code for a web page, or download a picture for a slide.
The harder part is choosing the right kind of motion for the place your chart will live. Sometimes the right choice is no motion at all. We make a chart maker ourselves, so we’ll say where ours fits and where another tool does the job better.
What counts as an animated chart?
An animated chart is a chart whose marks move to show how the picture got there or how it changed. Bars grow from the baseline and lines trace across the page. The motion comes in three kinds, each suited to a different job.
| Kind of motion | What moves, and what it’s good for |
|---|---|
| Entry | The chart draws in once, bars rising from the baseline. Good for drawing attention when a slide or page opens. |
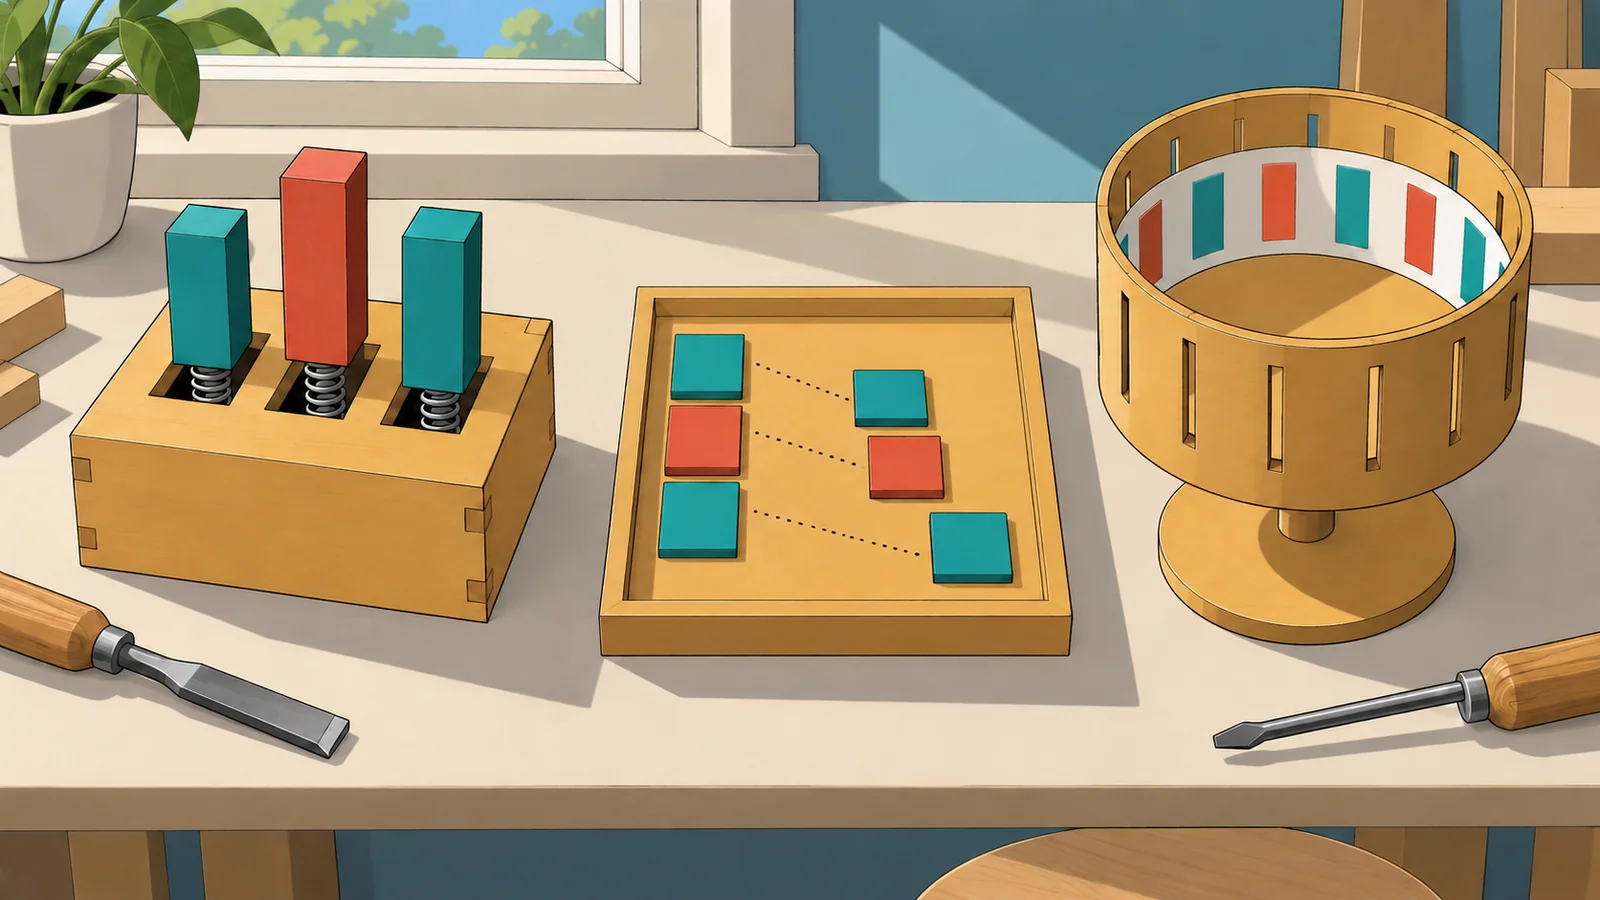
| Transition | Marks morph from one state to the next when data or chart type changes. Good for showing what changed without losing track of each item. |
| Playback | The chart plays through time steps, like a bar chart race. Good for a story about ranks or growth over many periods. |
The tools in today’s search results mostly offer entry motion, and a few offer playback. Tutorials rarely mention transitions, yet transitions have the most research behind them. In two controlled experiments, Heer and Robertson found that animated transitions between common charts “can significantly improve graphical perception” of what changed.
How to make an animated chart in 4 steps
To make an animated chart, paste your data, pick a chart type, check the motion, then embed or export the result. Here’s that route in our free chart maker. The maker needs no account, and while you build the chart, your data stays in your browser.
- Paste your data. Put labels in the first column and values in the next. Rows copied from Excel or Google Sheets work as they are, and so does a CSV file.
- Pick a chart type: column, bar, line, area, donut, waterfall or one of the others. Each time you switch, the chart morphs into the new shape and keeps your numbers.
- Check the motion. Change a value and watch which bar moves. If the movement is hard to follow, you probably have too many items, so cut the list or sort it.
- Export or embed. Choose “Copy embed” for a web page, where the chart stays live and animated. Choose “Download PNG” for a slide or a document, where it becomes a still image.
The maker and the embed are free. A free embed shows a small “Made with Meiku Charts” credit and a free PNG carries a meikucharts.com mark; Pro removes both. The embed snippet carries the numbers you published, so to change them later, edit the chart in the maker and paste the new snippet.
The chart below uses real data: NASA’s global temperature record for the last ten complete years. Each value is how much warmer that year was than the 1951–1980 average.
| Label | Anomaly |
|---|---|
| 2016 | 1.01 |
| 2017 | 0.92 |
| 2018 | 0.85 |
| 2019 | 0.98 |
| 2020 | 1.01 |
| 2021 | 0.85 |
| 2022 | 0.89 |
| 2023 | 1.17 |
| 2024 | 1.29 |
| 2025 | 1.19 |
2024 was the warmest year in NASA’s record, at 1.29 °C above the baseline in today’s file. NASA’s January 2025 announcement gave 1.28 °C; the agency revises past values as late data arrive. Try it yourself: type a new number into any row below, and the chart morphs to match.
Try it with your data
| Label | Value |
|---|---|
| 2016 | 1.01 |
| 2017 | 0.92 |
| 2018 | 0.85 |
| 2019 | 0.98 |
| 2020 | 1.01 |
| 2021 | 0.85 |
| 2022 | 0.89 |
| 2023 | 1.17 |
| 2024 | 1.29 |
| 2025 | 1.19 |
What makes chart motion easy to follow?
Good chart motion keeps every item recognisable from start to finish, so the reader’s eye can follow one bar to its new place. Four rules from the research do most of the work: keep each item the same item, give it about a second, ease in and out, and stage big changes.
Keep each item the same item
When a column becomes a point on a line, the reader should see it travel, not vanish and reappear. Heer and Robertson put it as keeping intermediate frames “valid data graphics.” Our charts keep track of each year, so the 2024 column turns into the 2024 point.
Give it about a second
Heer and Robertson’s advice is to “make transitions as long as needed, but no longer,” and they recommend around one second. A 2021 study by Liu, Craig and Polidoro found about 300 ms best on a personal screen. On a shared screen, where people didn’t start the change themselves, about 1,000 ms worked best. Our themes run between 0.7 and 1.15 seconds.
Ease in and out
A 2011 study at CHI compared constant-speed motion with motion that starts and ends slowly. “Slow-in/slow-out outperformed other techniques” for following moving objects.
Stage big changes
If both the scale and the values change, move one first and then the other. People preferred staged transitions in Heer and Robertson’s tests, but an extreme form of staging, with many steps in a row, made their errors worse.
Animated transitions between charts can significantly improve graphical perception.
How should a bar, line or pie chart move?
Bars should grow from zero, lines should trace from left to right, and pie slices should sweep from the top; when values change, each mark should change in place. Each of those motions matches how people read that chart type. Most tools won’t let you hand-tune them, but you can watch your chart once and check that it moves this way.
Animated bar chart
An animated bar chart should grow its bars from the zero baseline. The length of a bar is its value, so a bar that starts in mid-air, or bounces past its value before settling, misstates the number for a moment. When values change, each bar should stretch or shrink in place. If the order changes, let the bar slide to its new rank so the reader sees it overtake its neighbour.
Animated line chart
An animated line chart can trace from left to right, which reads as time passing. Keep the pace even across the x-axis, so a calm year doesn’t look slower than a dramatic one. When new data arrives, the points should move up or down to their new values instead of the whole line redrawing from scratch.
Animated pie chart
An animated pie chart usually sweeps its slices around from the top. Keep the sweep short, because people judge angles less precisely than lengths, and judging them while they move is harder still. When shares change, slices should grow and shrink in place. To compare shares between years, a bar chart usually works better.
Here are the same ten years as a line. To watch each year’s column travel to its point, paste the same rows into the chart maker and switch the shape between Column and Line.
| Label | Anomaly |
|---|---|
| 2016 | 1.01 |
| 2017 | 0.92 |
| 2018 | 0.85 |
| 2019 | 0.98 |
| 2020 | 1.01 |
| 2021 | 0.85 |
| 2022 | 0.89 |
| 2023 | 1.17 |
| 2024 | 1.29 |
| 2025 | 1.19 |
Which kind of motion fits your destination?
Use a live embed for a web page, a native PowerPoint chart for slides, a video tool for social media and a still picture for a PDF. A live embed keeps the motion and the readable numbers, while a video keeps only the motion. A picture keeps neither.
| Destination | Kind of motion | How to make it | Keeps the motion | To change a number |
|---|---|---|---|---|
| Web page or blog | Entry and transitions | Live embed from a browser chart maker | Yes | Edit in the maker, paste the new snippet |
| Slide deck | Entry, step by step | Native PowerPoint chart with Effect Options | Step by step [Only a native PowerPoint chart builds by series or category. A pasted PNG enters as one picture.] | Edit the chart data in PowerPoint |
| Social video | Playback | A tool that exports MP4 or GIF | Yes [Feeds do not run scripts, so the motion is recorded into the file and the numbers become pixels.] | Render the video again |
| Report or PDF | None | Still PNG or SVG | No | Export the picture again |
For a web page, the live embed is the strongest option. It’s a short snippet you paste into your page. The chart draws in when the page loads and stays sharp at any screen width. A hidden data table keeps the numbers readable for screen readers. See how to embed a live chart on any HTML page.
If you write the page’s code yourself, the same chart takes two lines of HTML: one script tag and one <live-chart> element holding the chart’s settings. To animate a change, give the chart new settings from your script, and it morphs from the old shape to the new one, even into a different chart type:
const chart = document.querySelector("live-chart");
chart.spec = { ...chart.spec, type: "line" };
For social media, you need a video file, because feeds don’t run scripts. Our maker doesn’t export video. Record your screen while the live chart plays, or use a dedicated video tool.
How to make an animated chart in PowerPoint
Select the chart, open the Animations tab, and choose an entrance effect such as Wipe or Fade. Then open Effect Options. Microsoft’s documentation lists the ways PowerPoint can build a chart: as one object, by series, by category, or one element at a time. This works only with a native PowerPoint chart. A pasted PNG enters as one picture, whatever you choose.
Build the chart as one object when it makes a single point you’ll talk over. Build it by series to bring in this year after last year, so the audience compares the two. Build it by category, one quarter at a time, when the story runs in order. Building element by element reveals every bar on its own click; it’s slow, so save it for charts with fewer than eight bars.
The exact labels vary between PowerPoint versions and chart types. Keep the chart linked to its data. Avoid tutorials that ungroup the chart into shapes or draw the bars by hand, because the animation then breaks every time a number changes.
Google Slides is more limited. Its help page covers animating “text, images, slides, and other objects,” with start options of “On click,” “After previous” and “With previous.” It doesn’t document chart-by-series animation, so expect a chart to enter as a single object.
What about a bar chart race?
A bar chart race is a playback chart: horizontal bars re-rank at each time step while a counter shows the year. Our maker doesn’t play time steps, so for a race use Flourish’s Bar Chart Race template or Canva’s “Bar race” chart. Here’s the Canva route, from its help centre:
- In the editor side panel, open Charts (if it isn’t there, open Apps first, then Charts).
- Under “Bar race charts,” pick “Bar race” or “Single color bar race.”
- Add your data: a label for each item, a value for each period, and a time column such as year.
- In Settings, adjust the playback speed and turn looping on or off.
Shape your table with one row per item per period: a row for each country in 2019, another for each country in 2020, and so on. Keep the race short.
Races are popular and contested. A 2023 study of animated bar charts found that transitions “play a key role in viewers’ perception of ranking changes,” and noted that “there are no design guidelines for animated bar charts.” Keep the axis fixed if you can. A rescaling axis makes every bar seem to shrink, even while its value grows.
When should you not animate a chart?
Skip animation when your reader needs to analyse the data rather than watch a short story. To compare many trends, use side-by-side small charts.
Robertson and colleagues tested this in 2008 with moving bubble charts like the ones the statistician Hans Rosling made famous. In their study, animation was “the least effective form” for analysing trends. Static views were faster, and a grid of small charts, one per period, was more accurate. Designers call that grid small multiples. Animation did win in one setting: when a presenter walked an audience through the story, it was the fastest, and people enjoyed it, though they still made many errors. A 2019 follow-up on phones by Brehmer and colleagues found the same speed advantage for small multiples, though accuracy depended on the task.

Missing data is another trap. If a year has no value, some playback tools slide smoothly across the gap and suggest a steady change that nobody measured. A gap should look like a gap. Our charts leave the slot empty and label it “No data” instead of drawing a zero or a fake slope.
A gap in the data should look like a gap.
How do you keep an animated chart accessible?
Respect the reduce-motion setting, keep autoplay short or pausable, and give screen readers the numbers. Those three habits cover the main accessibility rules for chart motion.
Phones and computers let people turn on “reduce motion,” and browsers expose that choice to web pages. The W3C notes that for people with vestibular disorders, animation can trigger “nausea, migraine headaches, and potentially needing bed rest to recover.” When the setting is on, our charts skip the motion and show the finished chart straight away.
Autoplay has a hard rule. Under WCAG 2.2 success criterion 2.2.2 (Level A), motion that starts on its own, lasts more than five seconds and sits next to other content needs a way to pause, stop or hide it. A looping bar chart race beside an article falls under it. A one-second entry animation that plays once doesn’t.

Screen readers can’t see a canvas, so every chart we draw carries a hidden data table with the same values. If your tool exports only a GIF, write the key numbers in the text around it.
Try every kind of transition in the chart maker, browse line graph examples built on the same engine, or read about animated charts that morph between types on our homepage.
Comments